|
|
Понравилась статья? Поделитесь с друзьями:
|
|
|
|
|
|
|
|
|
|

|
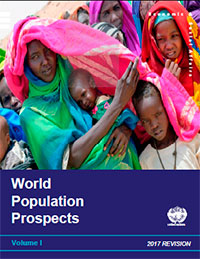
WORLD POPULATION PROSPECTS
THE 2017 REVISION
Volume I: Comprehensive Tables
New York, United Nations, 2017, 377 pages
|
https://esa.un.org/unpd/wpp/Publications/Files/WPP2017_Volume-I_Comprehensive-Tables.pdf
Нынешний Пересмотр прогноза народонаселения мира за
2017 год - это двадцать пятый раунд официальных оценок и прогнозов
в области народонаселения Организации Объединенных Наций, которые
готовятся с 1951 года. Пересмотр 2017 года основывается на предыдущих
версиях путем включения дополнительных результатов в раунды национальных
переписей населения 2010 и 2020 годов, а также результатов недавних
специализированных выборочных обследований по всему миру.
В этом томе Пересмотра 2017 года представлены всеобъемлющие
таблицы официальных оценок и прогнозов численности населения Организации
Объединенных Наций с отображением ключевых демографических показателей
для отдельных периодов с 1950 по 2100 год для мира, групп развития,
регионов, субрегионов и стран или районов с численностью населения
более 90000 жителей в 2017 году. Для стран или районов с населением
менее 90000 человек в 2017 году приводятся только цифры, относящиеся
к численности и росту населения. Во всех таблицах приводящиеся показатели
за 1950-2015 годы являются оценками, а за последующие годы последующие
- прогнозами. Прогнозы приведены по среднему, высокому, низкому
варианту, а также для варианта с неизменной рождаемостью. Таблицы
сопровождаются кратким анализом.
Результаты Пересмотра 2017 года представлены в двух
томах.
CONTENTS
PREFACE
EXPLANATORY NOTES
EXECUTIVE SUMMARY
TABLE
1. Population of the world and regions, 2017, 2030, 2050 and 2100,
according to the medium-variant projection
FIGURES
1. Distribution of the world's population by age and sex, 2017
2. Population of the world: estimates, 1950-2015, and medium-variant
projection with 95 per cent prediction intervals, 2015-2100
3. Population by region: estimates, 1950-2015, and medium-variant
projection, 2015-2100
4. Average annual rate of population change for the world and by
region, estimates, 2000-2015, and medium-variant projection, 2015-2100
5. Distribution of the world's population by level of total fertility,
1975-1980, 2010-2015 and 2045-2050
6. Life expectancy at birth (years) by region: estimates 1975-2015
and projections 2015-2050
7. Average annual net migration by region, 1980-2015
8. Percentage of population in broad age groups for the world and
by region, 2017
ANNEX TABLES
Population size and growth
A.1. Total population at mid-year by region and subregion: estimates
and medium variant, 1950-2100
A.2. Total population at mid-year by region and subregion: high
variant, 2015-2100
A.3. Total population at mid-year by region and subregion: low variant,
2015-2100
A.4. Total population at mid-year by region and subregion: constant-fertility
variant, 2015-2100
A.5. Average annual rate of population change by region and subregion:
estimates and medium variant, 1950-2100
A.6. Average annual rate of population change by region and subregion:
high variant, 2015-2100
A.7. Average annual rate of population change by region and subregion:
low variant, 2015-2100
A.8. Average annual rate of population change by region and subregion:
constant-fertility variant, 2015-2100
A.9. Total population at mid-year by region, subregion, country
and area: estimates and medium variant, 1950-2100
A.10. Total population at mid-year by region, subregion, country
and area: high variant, 2015-2100
A.11. Total population at mid-year by region, subregion, country
and area: low variant, 2015-2100
A.12. Total population at mid-year by region, subregion, country
and area: constant-fertility variant, 2015-2100
A.13. Average annual rate of population change by region, subregion,
country and area: estimates and medium variant, 1950-2100
A.14. Average annual rate of population change by region, subregion,
country and area: high variant, 2015-2100
A.15. Average annual rate of population change by region, subregion,
country and area: low variant, 2015-2100
A.16. Average annual rate of population change by region, subregion,
country and area: constant-fertility variant, 2015-2100
A.17. Annual interpolated mid-year population by region, subregion,
country and area: estimates, 1995-2015
A.18. Annual interpolated mid-year population by region, subregion,
country and area: medium variant, 2016-2035
Fertility
A.19. Crude birth rate by region, subregion, country and area:
estimates and medium variant, 1950-2100
A.20. Crude birth rate by region, subregion, country and area: high
variant, 2015-2100
A.21. Crude birth rate by region, subregion, country and area: low
variant, 2015-2100
A.22. Total fertility by region, subregion, country and area: estimates
and medium variant, 1950-2100
A.23. Total fertility by region, subregion, country and area: high
variant, 2015-2100
A.24. Total fertility by region, subregion, country and area: low
variant, 2015-2100
Mortality
A.25. Crude death rate by region, subregion, country and area:
estimates and medium variant, 1950-2100
A.26. Crude death rate by region, subregion, country and area: high
variant, 2015-2100
A.27. Crude death rate by region, subregion, country and area: low
variant, 2015-2100
A.28. Life expectancy at birth by region, subregion, country and
area: estimates and projections, 1950-2100
A.29. Infant mortality rate by region, subregion, country and area:
estimates and projections, 1950-2100
A.30. Under-five mortality by region, subregion, country and area:
estimates and projections 1950-2100
Population age composition and dependency ratios
A.31. Population by broad age group, region, subregion, country
and area: estimates and medium variant, 1950-2100
A.32. Population in school ages by region, subregion, country and
area: estimates and medium variant, 1950-2100
A.33. Dependency ratios by region, subregion, country and area:
estimates and medium variant, 1950-2100
|

